|
Socrates - Comenius 1: |
|
|
| |
|
Socrates - Comenius 1: |
|
|
| |
Chemistry
|
LABORATORY WORK No 5 |
||
|
Performed by: |
Julie Koldova, Marie Kopecna |
|
|
|
||
|
Conditions: |
t = 20 °C; p = 1013 hPa; φ = 42.5 % |
|
|
|
||
|
Topic: |
Density of Solid Substances |
|
|
|
||
|
Tasks: |
1. |
Compute density r of solid foods from the experimentally measured mass and volume of these substances. |
|
2. |
Compare the densities of various solid foods by means of a bar chart. |
|
|
|
||
|
Theory: |
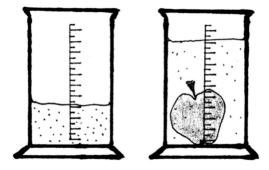
The density of a body is a quantity determined by the share of mass m and volume V of the body ρ = m / V. Density is measured in kg/m3. The mass of a body is established by weighing. The volume of symmetric bodies (rectangular parallelepiped, cube) can be computed according to the formula (V = a . b . c, V = a3). The volume of asymmetric bodies (insoluble in water) can be established by means of the change of water surface in graduated measuring glass. The volume of loose or sticky foods is established in graduated measuring glass. |
|
|
|
||
|
Aids: |
Kitchen scales, graduated measuring glass, ruler, foods according to the chart. |
|
|
|
||
|
Procedure: |
1. |
Establish the mass m [g] of the food on the kitchen scales either directly, or weigh the food first with the packing and afterwards the packing itself. Check the measured quantity according to the dates on the label. |
|
2. |
Pour the food (i.e. sugar) into the graduated measuring glass and establish volume V. Compare the measured volume by the foods packed in nearly symmetric packings (i. e. butter or flour) with the volume computed according to the formula (V = a . b . c). |
|
|
3. |
Determine the volume of foods that do not react with water (i. e. cucumber) through dipping them into the graduated measuring glass with water. |
|
|
4. |
Compute the density ρ [g/m3] of food according to the formula (ρ = m / V ). |
|
|
5. |
Make up the bar chart in which the length of column is directly proportional to the density. |
|
|
6. |
Find the foods with the biggest and smallest density in the chart. Further distinguish the foods the density of which is bigger or smaller than the density of water. |
|
|
|
||
|
Picture: |
 |
|
|
graduated measuring glass |
graduated measuring glass |
|
|
|
||
|
Table: |
Number |
Food |
Mass |
Volume |
Density |
|
1. |
chips |
200 |
1350 |
0.148 |
|
|
2. |
apple |
200 |
265 |
0.755 |
|
|
3. |
jam |
440 |
317 |
1.388 |
|
|
4. |
milk |
250 |
250 |
1.000 |
|
|
5. |
flour |
1000 |
1108 |
0.903 |
|
|
6. |
butter |
500 |
643 |
0.778 |
|
|
7. |
cucumber |
50 |
27 |
1.852 |
|
|
8. |
oat flakes |
500 |
900 |
0.556 |
|
|
9. |
rice |
1000 |
816 |
1.225 |
|
|
10. |
coffee cream |
108 |
50 |
2.160 |
|
|
11. |
salt |
1000 |
731 |
1.280 |
|
|
|
|||||
|
Chart: |
|
|
|
|
|
Conclusion: |
Coffee cream had the biggest density from the monitored foods [2.16 g/cm3], chips had the smallest density [0.148 g/cm3]. The density of salt [1.28 g/cm3] is bigger than of water, density of medium ground flour [ 0.903 g/cm3] is smaller than of water. The comparison of computed density of fat is interesting – density of butter is smaller than the one of water [0.778 g/cm3], while the density of coffee cream is bigger than of water [2.16 g/cm3], which doesn´t agree with reality as both float on water. |
|
|
|