|
Socrates - Comenius 1: |
|
|
| |
|
Socrates - Comenius 1: |
|
|
| |
Chemistry
|
LABORATORY WORK No 4 |
||
|
Performed by: |
Radek Chatrny, Jakub Prasek |
|
|
|
||
|
Conditions: |
t = 20.5 °C; p = 1018.5 hPa; φ = 48 % |
|
|
|
||
|
Topic: |
Density of Liquid Foods |
|
|
|
||
|
Tasks: |
1. |
Determine the density of liquid substances used in cooking. |
|
2. |
Compare the density of various liquid foods by means of bar chart. |
|
|
|
||
|
Theory: |
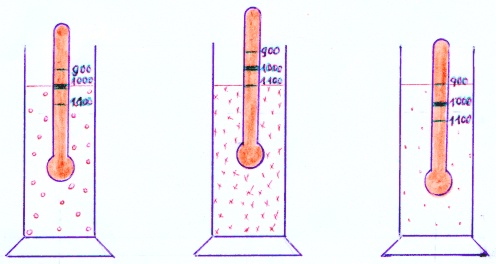
Density of a liquid is a quantity defined by proportion of mass m [kg] and volume V [m3] of the liquid. The derived unit of density is kg/m3. The density of liquids can be measured for example with hydrometer. The hydrometer is a hollow weighed glass tube that changes on the top into a narrow sealed tube with scale on which the consistence of liquid is determined. Hydrometer mustn´t touch either the bottom or the sides while submerged into the measured liquid. The less the density of the liquid, the deeper the hydrometer is dipped. It dips less in a dense liquid. The heavier the hydrometer, the more it dips in the liquid. The consistence of liquids depends on temperature. The density of warmer liquids is mostly smaller. |
|
|
|
||
|
Aids: |
Hydrometers, graduated vessel, 250 cm3 of liquid foods according to the chart. |
|
|
|
||
|
Procedure: |
1. |
Pour about 250 cm3 of investigated liquid food into a narrow graduated vessel. |
|
2. |
Dip the hydrometer into the liquid. |
|
|
3. |
Determine the consistence of liquid food in kg/m3 on the scale of the hydrometer. |
|
|
4. |
Make up a bar chart in which the length of the column is directly proportional to the density r [kg/m3]. |
|
|
5. |
Determine the liquid with the biggest and the smallest density from the chart. Compare the density of foods with the consistence of water. |
|
|
|
||
|
Picture: |
|
||
|
water with density |
liquid with density |
liquid with density |
|
|
|
|||
|
Chart: |
|||
|
Number of measuring |
Food |
Density ρ [kg/m3] |
|
|
1. |
drinking water |
1000 |
|
|
2. |
vinegar |
1200 |
|
|
3. |
orange juice |
1150 |
|
|
4. |
concentrated fruit syrup |
1380 |
|
|
5. |
low-fat long life milk |
834 |
|
|
6. |
Pepsi cola |
1200 |
|
|
7. |
vegetable cooking oil |
920 |
|
|
|
|||
|
Graph: |
|
|
|
|
|
Conclusion: |
From the measured foods in the household, the fruit syrup had the biggest density [1380 kg/m3], the low-fat long life milk had the smallest density [834 kg/m3]. Vinegar, juice and cola had bigger density than water, cooking oil and milk had smaller density. |
|
|
|